To help readers consolidate the content of this chapter, this section presents 3 set-related examples, with code provided in both Excel VBA and Python versions.
Application Example 1: Counting All Students in Interest Classes
As shown in Figure 9-5, columns A and B list the student names in the painting class and piano class, respectively. We now need to count all students in the interest classes.
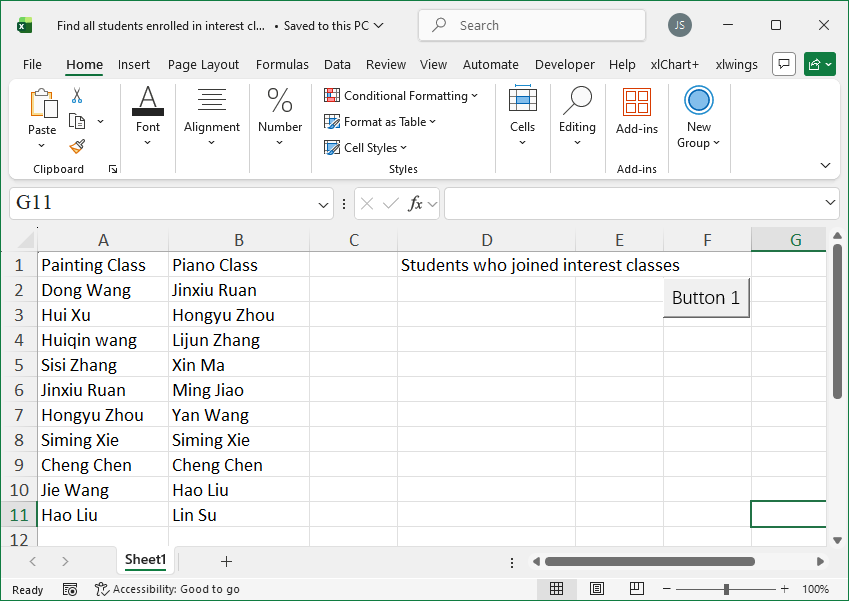
Figure 9-5
If we treat the painting class and piano class as two sets, the problem becomes computing the union of the two sets.
【Excel VBA】
Sample file path: Samples\ch09\Excel VBA\CountAllStudentsInInterestClasses.xlsm.
Sub Test()
    Dim intI As Integer
    Dim intR1 As Integer  ' Number of data in column A
    Dim intR2 As Integer  ' Number of data in column B
    Dim arr1(), arr2(), arr3()  ' Data from columns A and B, merged data
    Dim sht As Object
    Set sht = ActiveSheet

    ' Number of data in columns A and B
    intR1 = sht.Range("A1").End(xlDown).Row
    intR2 = sht.Range("B1").End(xlDown).Row

    ' Get data from columns A and B (2D)
    arr1 = sht.Range("A2:A" & CStr(intR1)).Value
    arr2 = sht.Range("B2:B" & CStr(intR2)).Value

    ' Convert 2D data from columns A and B to 1D
    arr1 = Application.WorksheetFunction.Transpose(arr1)
    arr2 = Application.WorksheetFunction.Transpose(arr2)

    ' Compute union
    arr3 = Union(arr1, arr2)

    ' Output merged result
    sht.Range("D2").Resize(UBound(arr3) - LBound(arr3) + 1, 1).Value = _
        Application.WorksheetFunction.Transpose(arr3)
End Sub
When running the program, the summary result is shown in column D of Figure 9-5.
【Python】
Sample data file path: Samples\ch09\Python\CountAllStudentsInInterestClasses.xlsx. The .py file is saved in the same directory, named sam09-01.py.
class="text-secondary">import xlwings class="text-secondary">as xw                  # Import xlwings package
class="text-secondary">from xlwings.constants class="text-secondary">import Direction  # Import Direction class="text-secondary">from constants class
class="text-secondary">import os                              # Import os package
# Get the current path of the .py file
root = os.getcwd()
# Create Excel application (visible, no workbook)
app = xw.App(visible=True, add_book=False)
# Open data file (writable)
bk = app.books.open(fullname=root + r'\CountAllStudentsInInterestClasses.xlsx', read_only=False)
sht = bk.sheets(1)  # Get the first worksheet
# Maximum row number of data in column A of the worksheet
row_num_1 = sht.api.Range('A1').End(Direction.xlDown).Row
# Maximum row number of data in column B of the worksheet
row_num_2 = sht.api.Range('B1').End(Direction.xlDown).Row
# Data from column A
data_1 = sht.range('A2:A' + str(row_num_1)).value
# Data from column B
data_2 = sht.range('B2:B' + str(row_num_2)).value
# Convert lists to sets
set_1 = set(data_1)
set_2 = set(data_2)
# Compute union
set_3 = set_1.union(set_2)
# Output union (all students in interest classes)
sht.range('D2').options(transpose=True).value = list(set_3)
When running the program, the summary result is shown in column D of Figure 9-5.
Application Example 2: Cross-Sheet Deduplication
As shown in Figure 9-6, the two figures above show two worksheets in a workbook, both containing department personnel information. We now need to delete duplicate data rows from the first worksheet that also exist in the second worksheet.
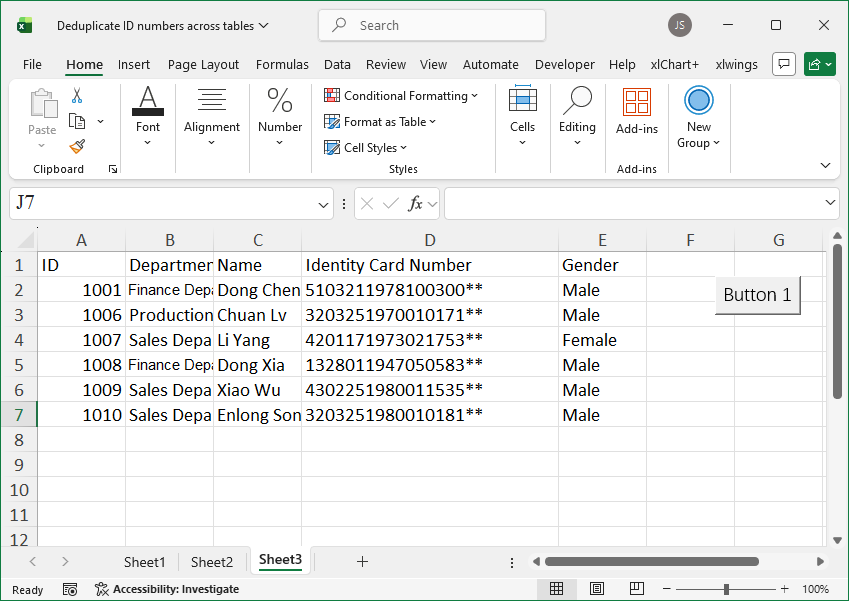
Figure 9-6
If we treat the "Employee ID" column data from the two worksheets as two sets, the problem becomes computing the difference of the two sets and copying the data rows corresponding to the employee IDs in the difference to the third worksheet.
【Excel VBA】
Sample file path: Samples\ch09\Excel VBA\CrossSheetDeduplication.xlsm.
Sub Test()
    Dim intI As Integer
    Dim intN As Integer
    Dim intR1 As Integer   ' Number of data in the first worksheet
    Dim intR2 As Integer   ' Number of data in the second worksheet
    Dim arr1(), arr2()     ' Data from the two worksheets
    Dim arr3()             ' Result of difference operation
    Dim sht1 As Worksheet, sht2 As Worksheet, sht3 As Worksheet

    Set sht1 = Sheets(1)
    Set sht2 = Sheets(2)
    Set sht3 = Sheets(3)

    ' Number of data in the two worksheets
    intR1 = sht1.Range("A1").End(xlDown).Row
    intR2 = sht2.Range("A1").End(xlDown).Row

    ' Get employee ID data from the two worksheets (2D)
    arr1 = sht1.Range("A2:A" & CStr(intR1)).Value
    arr2 = sht2.Range("A2:A" & CStr(intR2)).Value

    ' Convert employee ID data from the two worksheets from 2D to 1D
    arr1 = Application.WorksheetFunction.Transpose(arr1)
    arr2 = Application.WorksheetFunction.Transpose(arr2)

    ' Set difference: get employee IDs in the first worksheet that are not in the second
    arr3 = Difference(arr1, arr2)

    ' Output result to the third worksheet
    sht1.Rows(1).Copy sht3.Rows(1)
    intN = 1

    ' Iterate through column A of the first worksheet; if employee ID exists in the difference, copy the row to the third worksheet
    For intI = LBound(arr1) To UBound(arr1)
        If InArr(arr1(intI), arr3) Then
            intN = intN + 1
            sht1.Rows(intI + 1).Copy sht3.Rows(intN)
        End If
    Next

    sht3.Activate
End Sub
Function InArr(Val, arr()) As Boolean
    ' Check if Val exists in array arr
    Dim intI As Integer
    InArr = False
    For intI = LBound(arr) To UBound(arr)
        If Val = arr(intI) Then
            InArr = True
            Exit For
        End If
    Next
End Function
When running the program, the statistical result is shown in the lower figure of Figure 9-6.
【Python】
Sample data file path: Samples\ch09\Python\CrossSheetDeduplication.xlsx. The .py file is saved in the same directory, named sam09-02.py.
class="text-secondary">import xlwings class="text-secondary">as xw                  # Import xlwings package
class="text-secondary">from xlwings.constants class="text-secondary">import Direction  # Import Direction class="text-secondary">from constants class
class="text-secondary">import os                              # Import os package
# Get the current path of the .py file
root = os.getcwd()
# Create Excel application (visible, no workbook)
app = xw.App(visible=True, add_book=False)
# Open data file (writable)
bk = app.books.open(fullname=root + r'\CrossSheetDeduplication.xlsx', read_only=False)
sht1 = bk.sheets(1)  # Get the first worksheet
sht2 = bk.sheets(2)  # Get the second worksheet
sht3 = bk.sheets(3)  # Get the third worksheet
# Maximum row number of data in column A of the first worksheet
row_num_1 = sht1.api.Range('A1').End(Direction.xlDown).Row
# Maximum row number of data in column A of the second worksheet
row_num_2 = sht2.api.Range('A1').End(Direction.xlDown).Row
# Column A data from the first worksheet
data_1 = sht1.range('A2:A' + str(row_num_1)).value
# Column A data from the second worksheet
data_2 = sht2.range('A2:A' + str(row_num_2)).value
# Convert lists to sets
set_1 = set(data_1)
set_2 = set(data_2)
# Difference operation
set_3 = set_1.difference(set_2)
# Copy header
sht1.api.Rows(1).Copy()       # Copy the first row of the first worksheet
sht3.api.Activate()            # For cross-sheet copying, activate the target worksheet first
sht3.api.Range('A1').Select()  # Select the paste location
sht3.api.Paste()               # Paste
# Iterate through column A of the first worksheet; if the current employee ID exists in set_3, copy the row to the third worksheet
n = 1  # Record the row number for pasting data
for i in range(2, row_num_1 + 1):
    if sht1.cells(i, 1).value in set_3:
        n += 1
        sht1.api.Rows(i).Copy()  # Copy entire row
        sht3.api.Activate()
        sht3.api.Rows(n).Select()
        sht3.api.Paste()
When running the program, the statistical result is shown in the lower figure of Figure 9-6.
Application Example 3: Identifying Students in Both or Only One Interest Class
As shown in Figure 9-7, columns A and B of the worksheet list the student names in the painting class and piano class, respectively. We now need to count students who joined both interest classes and students who joined only one interest class.
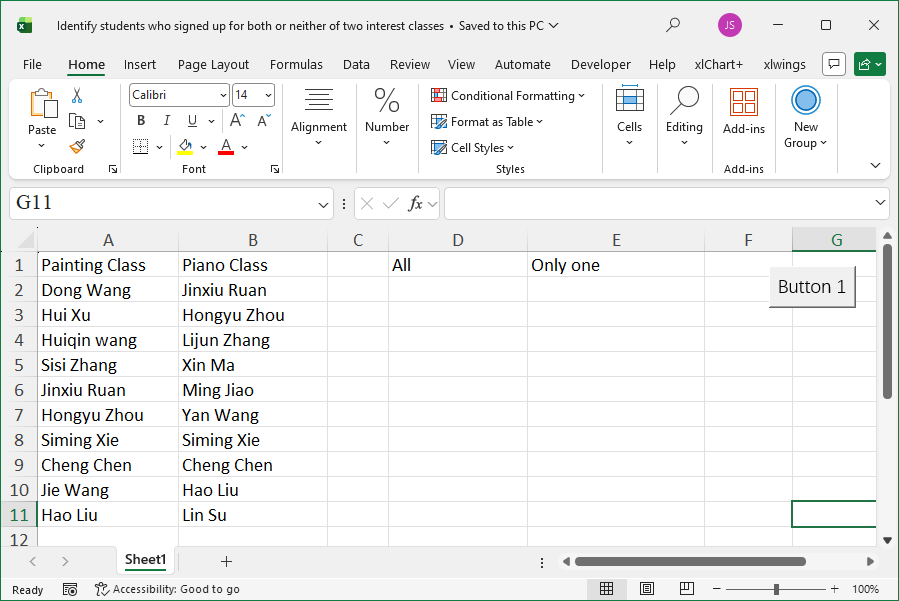
Figure 9-7
If we treat the painting class and piano class as two sets, then counting students who joined both classes is computing the intersection of the two sets, and counting students who joined only one class is computing the symmetric difference of the two sets.
【Excel VBA】
Sample file path: Samples\ch09\Excel VBA\IdentifyStudentsInBothOrOnlyOneClass.xlsm.
Sub Test()
    Dim intI As Integer
    Dim intR1 As Integer   ' Number of data in column A
    Dim intR2 As Integer   ' Number of data in column B
    Dim arr1(), arr2()     ' Data from columns A and B
    Dim arr3(), arr4()     ' Results of intersection and symmetric difference
    Dim sht As Object
    Set sht = ActiveSheet

    ' Number of data in columns A and B
    intR1 = sht.Range("A1").End(xlDown).Row
    intR2 = sht.Range("B1").End(xlDown).Row

    ' Get data from columns A and B (2D)
    arr1 = sht.Range("A2:A" & CStr(intR1)).Value
    arr2 = sht.Range("B2:B" & CStr(intR2)).Value

    ' Convert 2D data from columns A and B to 1D
    arr1 = Application.WorksheetFunction.Transpose(arr1)
    arr2 = Application.WorksheetFunction.Transpose(arr2)

    ' Compute intersection: students in both classes
    arr3 = Intersection(arr1, arr2)
    ' Compute symmetric difference: students in only one class
    arr4 = SymDif(arr1, arr2)

    ' Output results
    sht.Range("D2").Resize(UBound(arr3) - LBound(arr3) + 1, 1).Value = _
        Application.WorksheetFunction.Transpose(arr3)
    sht.Range("E2").Resize(UBound(arr4) - LBound(arr4) + 1, 1).Value = _
        Application.WorksheetFunction.Transpose(arr4)
End Sub
When running the program, the statistical result is shown in columns D and E of Figure 9-7.
【Python】
Sample data file path: Samples\ch09\Python\IdentifyStudentsInBothOrOnlyOneClass.xlsx. The .py file is saved in the same directory, named sam09-03.py.
class="text-secondary">import xlwings class="text-secondary">as xw                  # Import xlwings package
class="text-secondary">from xlwings.constants class="text-secondary">import Direction  # Import Direction class="text-secondary">from constants class
class="text-secondary">import os                              # Import os package
# Get the current path of the .py file
root = os.getcwd()
# Create Excel application (visible, no workbook)
app = xw.App(visible=True, add_book=False)
# Open data file (writable)
bk = app.books.open(fullname=root + r'\IdentifyStudentsInBothOrOnlyOneClass.xlsx', read_only=False)
sht = bk.sheets(1)  # Get the first worksheet
# Maximum row number of data in column A of the worksheet
row_num_1 = sht.api.Range('A1').End(Direction.xlDown).Row
# Maximum row number of data in column B of the worksheet
row_num_2 = sht.api.Range('B1').End(Direction.xlDown).Row
# Column A data
data_1 = sht.range('A2:A' + str(row_num_1)).value
# Column B data
data_2 = sht.range('B2:B' + str(row_num_2)).value
# Convert lists to sets
set_1 = set(data_1)
set_2 = set(data_2)
# Compute intersection
set_3 = set_1.intersection(set_2)
# Compute symmetric difference
set_4 = set_1.symmetric_difference(set_2)
# Output intersection (students in both classes)
sht.range('D2').options(transpose=True).value = list(set_3)
# Output symmetric difference (students in only one class)
sht.range('E2').options(transpose=True).value = list(set_4)
When running the program, the statistical result is shown in columns D and E of Figure 9-7.