After creating or obtaining a pivot table, you can edit its elements, such as adding or modifying fields, setting the number format of table fields, and setting the format of cell ranges.
Adding Fields
For an existing pivot table, you can add fields. To add page, column, and row fields, use the AddFields method of the PivotTable object; to add a value field, use the AddDataField method.
[Excel VBA] The sample file path is Samples\ch19\Excel VBA\ Adding Fields.xlsm. Run the CreatePVT procedure to create a simple pivot table, setting “Product” as the column field and “Origin” as the row field (code omitted). Running the procedure creates the pivot table shown in Figure 7-4.
The AddFields procedure adds fields to the newly created pivot table: use the AddFields method of the PivotTable object to add “Category” as the page field, and the AddDataField method to add “Amount” as the value field.
Sub AddFields()
    ' Omitted: get pivot table pvt
    ' ...
    With pvt
        .AddFields PageFields:="Category", AddToTable:=True    ' Page field
        .AddDataField .PivotFields(“Amount”), "sum:Amoiunt", xlSum   ' Value field
    End With
End Sub
Running the procedure generates the pivot table shown in Figure 7-3.
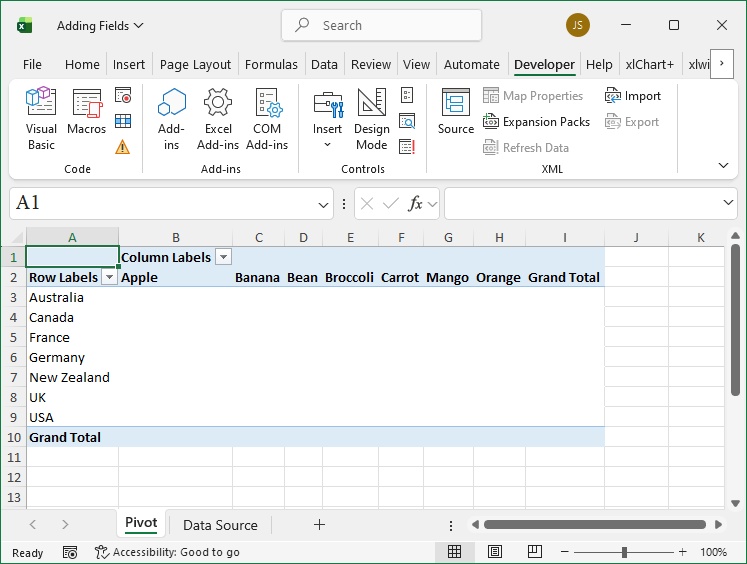
Figure 7-4
[Python] The Python script file path is Samples\ch19\Python\Adding Fields.py.
(Omitted code for brevity; refer to the Python file.)
First, create a simple pivot table with “Product” as the column field and “Origin” as the row field.
Create the pivot table:
pvt = sht_pvt.api.PivotTableWizard(
    SourceType=xw.constants.PivotTableSourceType.xlDatabase,
    SourceData=rng_data
)
pvt.Name = 'Pivot'
Set fields:
pvt.PivotFields(‘Product’).Orientation = \
    xw.constants.PivotFieldOrientation.xlColumnField   # Column field
pvt.PivotFields(‘Product’).Position = 1
pvt.PivotFields(‘Origin’).Orientation = \
    xw.constants.PivotFieldOrientation.xlRowField     # Row field
pvt.PivotFields(‘Origin’).Position = 1
Use the AddFields method to add “Category” as the page field, and the AddDataField method to add “Amount” as the value field.
Add page field:
pvt.AddFields(PageFields='Category', AddToTable=True)Add value field:
pvt.AddDataField(pvt.PivotFields('Amouint'), 'sum:Amount', \
    xw.constants.ConsolidationFunction.xlSum)
Running the script generates the pivot table shown in Figure 7-3.
Modifying Fields
You can modify the properties of existing pivot table field objects. For example, if “Amount” is specified as the value field when creating the pivot table, a default active field named “sum:Amount” is generated (as shown in cell A3 of the worksheet in Figure 7-2). Below, use the Name property of the PivotField object to rename this field to “ Amount ” (note: spaces are added before and after “Amount” because it is an existing field name).
[Excel VBA] The sample file path is Samples\ch19\Excel VBA\ Modifying Fields.xlsm. Run the CreatePVT procedure to generate the pivot table, then run the RenameField procedure to modify the field name (code of CreatePVT omitted).
The code of the RenameField procedure is as follows:
Sub RenameField()
    ' Omitted: get pivot table pvt
    ' ...
    pvt.PivotFields("sum:Amount").Name = " Amount "  ' Modify field name
End Sub
Running the procedure changes the field name in cell A3, as shown in Figure 7-5.
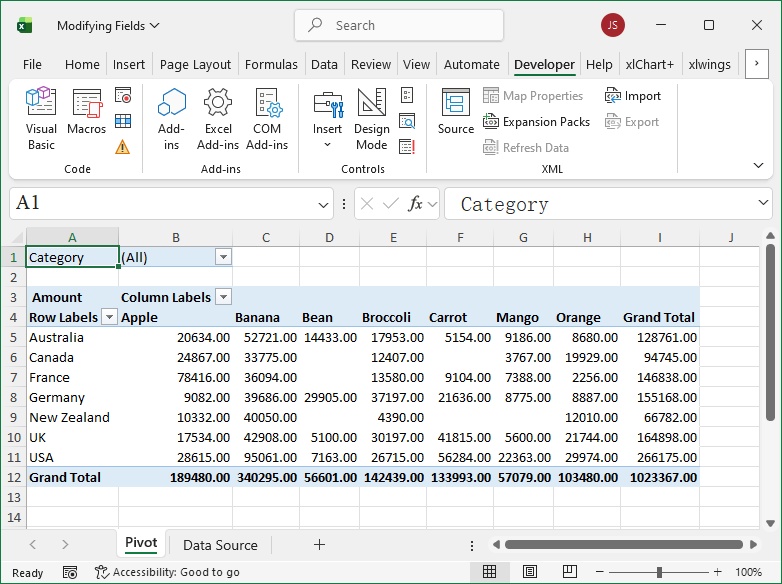
Figure 7-5
[Python] The Python script file path is Samples\ch19\Python\ Modifying Fields.py. First, create the pivot table with “Amount” as the value field (generating the active field “sum:Amount”), then use the Name property of the PivotField object to rename it to “ Amount ”.
(Omitted code for brevity; refer to the Python file.)
Set fields:
pvt.PivotFields(‘Amount’).Orientation = \
    xw.constants.PivotFieldOrientation.xlDataField  # Value field
Modify field name:
pvt.PivotFields(' sum of Amount ').Name = ' Amount 'Running the script completes the field name modification.
Setting Number Format for Fields
Use the NumberFormat property of the PivotField object to modify the number format of a specified field. For example, create a pivot table and set the number format of the active field “sum:Amount” to two decimal places.
[Excel VBA] The sample file path is Samples\ch19\Excel VBA\ Setting the Number Format of Fields.xlsm. Run the CreatePVT procedure to generate the pivot table.
Run the NumberFormat procedure to set the number format of the active field “sum:Amount” to two decimal places.
Sub NumberFormat()
    ' Omitted: get pivot table pvt
    ' ...
    pvt.PivotFields("sum:Amount ").NumberFormat = "0.00"  ' Two decimal places
End Sub
Running the procedure generates the pivot table shown in Figure 7-6.
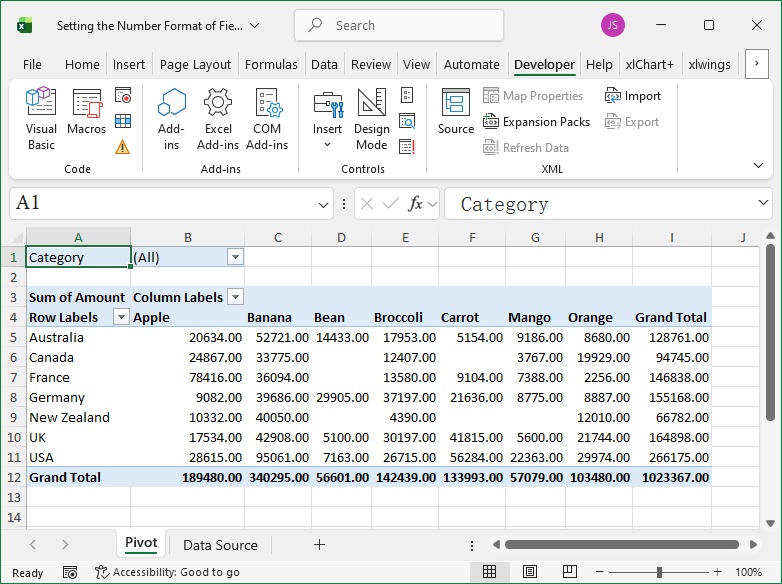
Figure 7-6
[Python] The Python script file path is Samples\ch19\Python\ Setting the Number Format of Fields.py.
(Omitted code for brevity; refer to the Python file.)
Set number format:
pvt.PivotFields('sum:Amount').NumberFormat = '0.00'Running the script generates the pivot table shown in Figure 7-6.
Setting Format of Cell Ranges
Use the DataBodyRange property of the PivotTable object to set properties of the data area cell range (e.g., background color, font properties); use the DataRange property of the PivotField object to set properties of the cell range corresponding to a field.
Below, create a pivot table, set the background color of the data area to gray, the font to Times New Roman, the background color of the “Product” field cell range to green, and the background color of the “Origin” field cell range to yellow.
[Excel VBA] The sample file path is Samples\ch19\Excel VBA\ Setting the Cell Area Properties of the Pivot Table.xlsm. Run the CreatePVT procedure to generate the pivot table.
Run the RangeFormat procedure to set the background color of the data area to gray and the font to Times New Roman.
Sub RangeFormat()
    ' Omitted: get pivot table pvt
    ' ...
    ' Set data area background color to gray
    pvt.DataBodyRange.Interior.Color = RGB(200, 200, 200)
    ' Set data area font to "Times New Roman"
    pvt.DataBodyRange.Font.Name = "Times New Roman"
End Sub
Run the RangeFormat2 procedure to set the background color of the “Product” field cell range to green and the “Origin” field cell range to yellow.
Sub RangeFormat2()
    ' Omitted: get pivot table pvt
    ' ...
    ' Set "Product" field cell range background color to green
    pvt.PivotFields(“Product”).DataRange.Interior.Color = RGB(0, 255, 0)
    ' Set "Origin" field cell range background color to yellow
    pvt.PivotFields(“Origin”).DataRange.Interior.Color = RGB(255, 255, 0)
End Sub
Running the procedures generates the pivot table shown in Figure 7-7.
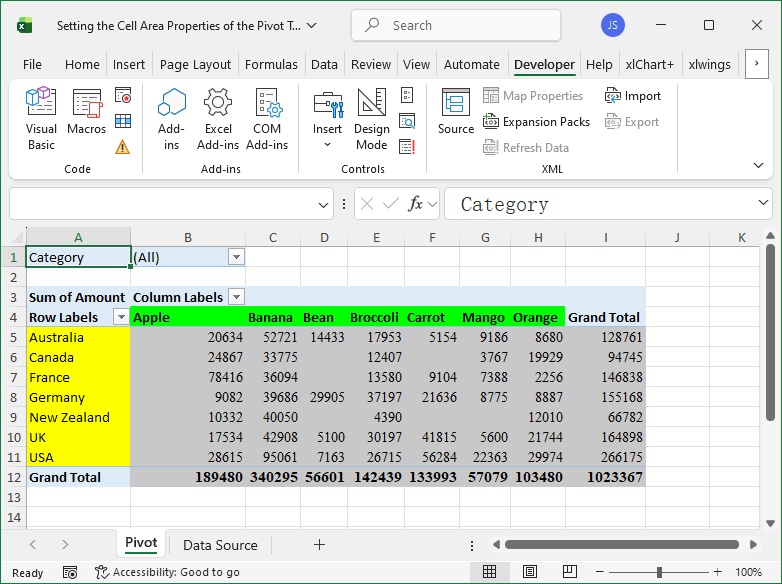
Figure 7-7
[Python] The Python script file path is Samples\ch19\Python\ Setting the Cell Area Properties of the Pivot Table.py.
(Omitted code for brevity; refer to the Python file.)
Set data area cell range properties:
pvt.DataBodyRange.Interior.Color = xw.utils.rgb_to_int((200, 200, 200))
pvt.DataBodyRange.Font.Name = 'Times New Roman'
Set “Product” field cell range background color to green:
pvt.PivotFields(‘Product’).DataRange.Interior.Color = \
    xw.utils.rgb_to_int((0, 255, 0))
Set “Origin” field cell range background color to yellow:
pvt.PivotFields(‘Origin’).DataRange.Interior.Color = \
    xw.utils.rgb_to_int((255, 255, 0))
Running the script generates the pivot table shown in Figure 7-7.