This section introduces the creation of basic graphic elements provided by Excel, including points, straight line segments, rectangles, ellipses, polylines, polygons, curves, labels, text boxes, callouts, AutoShapes, and WordArt.
In the Excel object model, the Shape object represents a graphic. The Shapes object acts as a collection to store and manage all graphics. The process of creating graphics programmatically involves creating a Shape object and programming using its properties and methods along with related objects.
Points
Although the Shapes object does not provide a dedicated method for drawing points, certain special shape types in AutoShapes can represent points, such as stars, rectangles, circles, and diamonds. These can be created using the AddShape method of the Shapes object. The syntax of the AddShape method is as follows:
[Excel VBA]
sht.Shapes.AddShape(Type, Left, Top, Width, Height)[Python]
sht.api.Shapes.AddShape(Type, Left, Top, Width, Height)Here, Python uses the xlwings API calling method, and sht denotes a worksheet object. The AddShape method returns a Shape object. The meaning of each parameter is shown in Table 5-1.
Table 5-1 Meaning of AddShape method parameters
| Name | Required/Optional | Data Type | Meaning |
|---|---|---|---|
| Type | Required | msoAutoShapeType | Specifies the type of AutoShape to create |
| Left | Required | Single | Position of the top-left corner of the shape’s bounding box relative to the document’s top-left corner (in points) |
| Top | Required | Single | Position of the top-left corner of the shape’s bounding box relative to the document’s top edge (in points) |
| Width | Required | Single | Width of the shape’s bounding box (in points) |
| Height | Required | Single | Height of the shape’s bounding box (in points) |
The Type parameter is of the msoAutoShapeType enumeration type and has many possible values. Table 5-2 lists some star shapes used as points.
Table 5-2 Values of Type parameter for star shapes
| Name | Value | Description |
|---|---|---|
| msoShape10pointStar | 149 | Decagon star |
| msoShape12pointStar | 150 | Dodecagon star |
| msoShape16pointStar | 94 | Hexadecagon star |
| msoShape24pointStar | 95 | 24-point star |
| msoShape32pointStar | 96 | 32-point star |
| msoShape4pointStar | 91 | 4-point star |
| msoShape5pointStar | 92 | 5-point star |
| msoShape6pointStar | 147 | 6-point star |
Below we create 5-point, 12-point, and 32-point stars as points.
[Excel VBA] Sample file path: Samples\ch17\Excel VBA\点.xlsm.
Sub Test()
    ActiveSheet.Shapes.AddShape 92, 180, 80, 10, 10   'Add point at specified position
    ActiveSheet.Shapes.AddShape 150, 150, 40, 15, 15
    ActiveSheet.Shapes.AddShape 96, 80, 80, 3, 3
End Sub
Running the procedure generates the star points shown in Figure 5-1.

Figure 5-1
[Python] In the Python Shell:
>>> import xlwings as xw   # Import xlwings package
>>> bk = xw.Book()         # Create new workbook
>>> sht = bk.sheets(1)     # Get first worksheet
>>> sht.api.Shapes.AddShape(92, 180, 80, 10, 10)   # Add point at specified position
>>> sht.api.Shapes.AddShape(150, 150, 40, 15, 15)
>>> sht.api.Shapes.AddShape(96, 80, 80, 3, 3)
The resulting star points are shown in Figure 5-1.
Rectangles and circles can also represent points; this will be covered in Section 5.1.3.
Straight Line Segments
Use the AddLine method of the Shapes object to create a straight line segment. Syntax:
[Excel VBA]
sht.Shapes.AddLine(BeginX, BeginY, EndX, EndY)[Python]
sht.api.Shapes.AddLine(BeginX, BeginY, EndX, EndY)Here, sht is a worksheet object; BeginX and BeginY are the coordinates of the start point; EndX and EndY are the coordinates of the end point. The method returns a Shape object representing the line segment.
Below we add a line segment starting at (10,10) and ending at (250,250) to worksheet sht, set its line style to dotted, color to red, and width to 5 points.
[Excel VBA] Sample file: Samples\ch17\Excel VBA\Line Segment.xlsm.
Sub Test()
    Dim shp As Shape
    Dim objLn As Object
    Set shp = ActiveSheet.Shapes.AddLine(10, 10, 250, 250)
    Set objLn = shp.Line
    objLn.DashStyle = 3                 ' Set dash style
    objLn.ForeColor.RGB = RGB(255, 0, 0) ' Red
    objLn.Weight = 5                     ' 5 points wide
End Sub
Running the procedure generates the line segment shown in Figure 5-2.
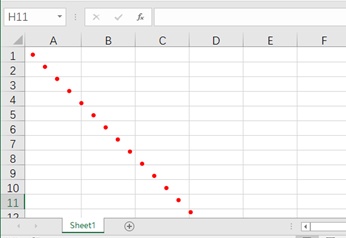
Figure 5-2
[Python]
>>> shp = sht.api.Shapes.AddLine(10, 10, 250, 250)
>>> ln = shp.Line
>>> ln.DashStyle = 3
>>> ln.ForeColor.RGB = xw.utils.rgb_to_int((255, 0, 0))
>>> ln.Weight = 5
The line segment is shown in Figure 5-2.
Rectangles, Rounded Rectangles, Ellipses, and Circles
Use the AddShape method to create rectangles, rounded rectangles, ellipses, and circles (circles are ellipses with equal axes). The relevant Type parameter values are shown in Table 5-3.
Table 5-3 Type parameter values for AddShape
| Name | Value | Description |
|---|---|---|
| msoShapeRectangle | 1 | Rectangle |
| msoShapeRoundedRectangle | 5 | Rounded rectangle |
| msoShapeOval | 9 | Ellipse |
By default, rectangles and circles are solid filled. Setting the Visible property of the Fill object to False creates outline shapes.
[Excel VBA] Sample file: Samples\ch17\Excel VBA\Rectangle Ellipse.xlsm.
Sub Test()
    ActiveSheet.Shapes.AddShape 1, 50, 50, 100, 200      ' Rectangle
    ActiveSheet.Shapes.AddShape 5, 100, 100, 100, 200   ' Rounded rectangle
    ActiveSheet.Shapes.AddShape 9, 150, 150, 100, 200   ' Ellipse
    ActiveSheet.Shapes.AddShape 9, 200, 200, 100, 100   ' Circle
End Sub
Results are shown in Figure 5-3.
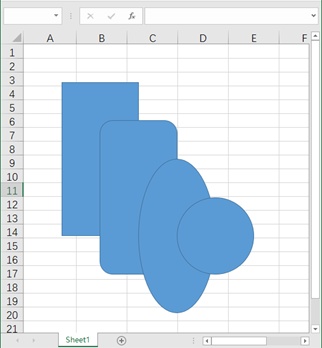
Figure 5-3
[Python]
>>> sht.api.Shapes.AddShape(1, 50, 50, 100, 200)      # Rectangle
>>> sht.api.Shapes.AddShape(5, 100, 100, 100, 200)   # Rounded rectangle
>>> sht.api.Shapes.AddShape(9, 150, 150, 100, 200)   # Ellipse
>>> sht.api.Shapes.AddShape(9, 200, 200, 100, 100)   # Circle
To create unfilled outlines:
[Excel VBA]
Sub Test2()
    Dim shp1 As Shape, shp2 As Shape, shp3 As Shape, shp4 As Shape
    Set shp1 = ActiveSheet.Shapes.AddShape(1, 50, 50, 100, 200)
    Set shp2 = ActiveSheet.Shapes.AddShape(5, 100, 100, 100, 200)
    Set shp3 = ActiveSheet.Shapes.AddShape(9, 150, 150, 100, 200)
    Set shp4 = ActiveSheet.Shapes.AddShape(9, 200, 200, 100, 100)
    shp1.Fill.Visible = msoFalse
    shp2.Fill.Visible = msoFalse
    shp3.Fill.Visible = msoFalse
    shp4.Fill.Visible = msoFalse
End Sub
[Python]
>>> shp1 = sht.api.Shapes.AddShape(1, 50, 50, 100, 200)
>>> shp1.Fill.Visible = False
>>> shp2 = sht.api.Shapes.AddShape(5, 100, 100, 100, 200)
>>> shp2.Fill.Visible = False
>>> shp3 = sht.api.Shapes.AddShape(9, 150, 150, 100, 200)
>>> shp3.Fill.Visible = False
>>> shp4 = sht.api.Shapes.AddShape(9, 200, 200, 100, 100)
>>> shp4.Fill.Visible = False
Results are shown in Figure 5-4.
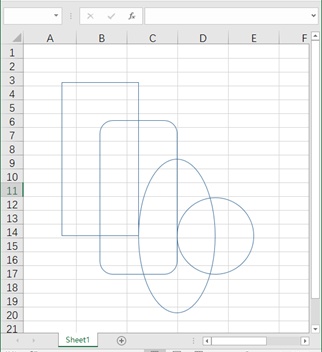
Figure 5-4
Polylines and Polygons
Polylines and polygons can be created using the AddPolyline method of the Shapes object. The syntax of the AddPolyline method is as follows.
【Excel VBA】
sht.Shapes.AddPolyline(SafeArrayOfPoints)
【Python】
sht.api.Shapes.AddPolyline(SafeArrayOfPoints)
Here, sht represents a worksheet object. The parameter SafeArrayOfPoints specifies the coordinates of the vertices of the polyline or polygon. The AddPolyline method returns a Shape object representing the polyline or polygon. Each vertex is represented by its x and y coordinate pair, and all vertices are represented by a two-dimensional list.
Below is an example of drawing a polygon given specific vertex coordinates.
【Excel VBA】 The sample file path is: Samples\ch17\Excel VBA\Polylines and Polygons.xlsm.
Sub Test()
    Dim pts(4, 1) As Single  'vertices
    pts(0, 0) = 10: pts(0, 1) = 10
    pts(1, 0) = 50: pts(1, 1) = 150
    pts(2, 0) = 90: pts(2, 1) = 80
    pts(3, 0) = 70: pts(3, 1) = 30
    pts(4, 0) = 10: pts(4, 1) = 10
    ActiveSheet.Shapes.AddPolyline pts
End Sub
Running this procedure generates the polygon region shown in Figure 5-5.
【Python】 Because there are issues with drawing polylines and polygons using the xlwings package, this section uses the comtypes package in Python. Similar to win32com and xlwings, comtypes is based on the COM mechanism.
First, install the comtypes package via the DOS command window: pip install comtypes
Then, enter the following in the Python Shell:
>>> from comtypes.client import CreateObject
>>> app2 = CreateObject('Excel.Application')   # Create Excel application
>>> app2.Visible = True                       # Make application window visible
>>> bk2 = app2.Workbooks.Add()                # Add workbook
>>> sht2 = bk2.Sheets(1)                      # Get first worksheet
>>> pts = [[10,10], [50,150], [90,80], [70,30], [10,10]]  # Polygon vertices
>>> sht2.Shapes.AddPolyline(pts)              # Add polygon region
The generated polygon region is shown in Figure 5-5.
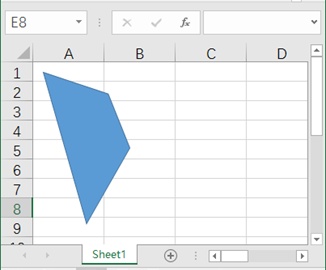
Figure5-5
If only the polygon outline is needed, set the Visible property of the Fill property of the Shape object representing the polygon region to False.
【Excel VBA】 The sample file path is: Samples\ch17\Excel VBA\Polylines and Polygons.xlsm.
Sub Test2()
    Dim shp As Shape
    Dim pts(4, 1) As Single
    pts(0, 0) = 10: pts(0, 1) = 10
    pts(1, 0) = 50: pts(1, 1) = 150
    pts(2, 0) = 90: pts(2, 1) = 80
    pts(3, 0) = 70: pts(3, 1) = 30
    pts(4, 0) = 10: pts(4, 1) = 10
    Set shp = ActiveSheet.Shapes.AddPolyline(pts)
    shp.Fill.Visible = msoFalse
End Sub
Running this procedure generates the polyline shown in Figure 5-6.
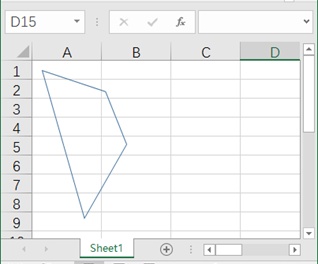
Figure 5-6
【Python】 Enter the following in the Python Shell:
>>> pts = [[10,10], [50,150], [90,80], [70,30], [10,10]]
>>> shp = sht2.Shapes.AddPolyline(pts)
>>> shp.Fill.Visible = False  # Polyline
The generated polyline is shown in Figure 5-6.
Curves
Curves can be created using the AddCurve method of the Shapes object. The syntax of the AddCurve method is as follows.
【Excel VBA】
sht.Shapes.AddCurve(SafeArrayOfPoints)
【Python】
sht.api.Shapes.AddCurve(SafeArrayOfPoints)
Here, sht represents a worksheet object. The parameter SafeArrayOfPoints specifies the coordinates of Bézier curve vertices and control points. The number of specified points is always 3n + 1, where n is the number of curve segments. The AddCurve method returns a Shape object representing the Bézier curve. Each vertex is represented by its x and y coordinate pair, and all vertices are represented by a two-dimensional list.
Below is an example of adding a Bézier curve to worksheet sht. For the same reason as in Section 5.1.5, this section uses the comtypes package for drawing.
【Excel VBA】 The sample file path is: Samples\ch17\Excel VBA\Curves.xlsm.
Sub Test()
    Dim pts(6, 1) As Single  'vertices
    pts(0, 0) = 0: pts(0, 1) = 0
    pts(1, 0) = 72: pts(1, 1) = 72
    pts(2, 0) = 100: pts(2, 1) = 40
    pts(3, 0) = 20: pts(3, 1) = 50
    pts(4, 0) = 90: pts(4, 1) = 120
    pts(5, 0) = 60: pts(5, 1) = 30
    pts(6, 0) = 150: pts(6, 1) = 90
    ActiveSheet.Shapes.AddCurve pts
End Sub
Running this procedure generates the Bézier curve shown in Figure 5-7.
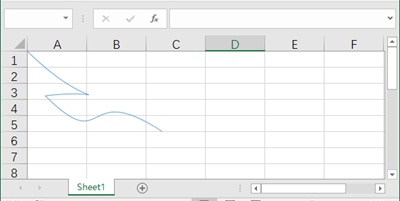
Figure 5-7
【Python】 Enter the following in the Python Shell:
>>> from comtypes.client import CreateObject
>>> app2 = CreateObject('Excel.Application')
>>> app2.Visible = True
>>> bk2 = app2.Workbooks.Add()
>>> sht2 = bk2.Sheets(1)
>>> pts = [[0,0], [72,72], [100,40], [20,50], [90,120], [60,30], [150,90]]  # Vertices
>>> sht2.Shapes.AddCurve(pts)  # Add Bézier curve
The generated Bézier curve is shown in Figure 5-7.
Labels
Labels can be created using the AddLabel method of the Shapes object. The syntax of the AddLabel method is as follows.
【Excel VBA】
sht.Shapes.AddLabel(Orientation, Left, Top, Width, Height)
【Python】
sht.api.Shapes.AddLabel(Orientation, Left, Top, Width, Height)
Here, sht represents a worksheet object. The parameters of the AddLabel method are listed in Table 5-4. The AddLabel method returns a Shape object representing the label.
Table 5-4 Parameters of the AddLabel Method
| Name | Required/Optional | Data Type | Description |
|---|---|---|---|
| Orientation | Required | msoTextOrientation | Direction of text in the label |
| Left | Required | Single | Position of the top-left corner of the label relative to the top-left corner of the document (in points) |
| Top | Required | Single | Position of the top-left corner of the label relative to the top of the document (in points) |
| Width | Required | Single | Width of the label (in points) |
| Height | Required | Single | Height of the label (in points) |
The Orientation parameter specifies the direction of text in the label, with values listed in Table 5-5.
Table 5-5 Values of the Orientation Parameter
| Name | Value | Description |
|---|---|---|
| msoTextOrientationDownward | 3 | Downward |
| msoTextOrientationHorizontal | 1 | Horizontal |
| msoTextOrientationHorizontalRotatedFarEast | 6 | Horizontal and rotated for Far East language support |
| msoTextOrientationMixed | -2 | Not supported |
| msoTextOrientationUpward | 2 | Upward |
| msoTextOrientationVertical | 5 | Vertical |
| msoTextOrientationVerticalFarEast | 4 | Vertical for Far East language support |
Below is an example of adding a vertical label containing text to worksheet sht.
【Excel VBA】 The sample file path is: Samples\ch17\Excel VBA\Labels.xlsm.
Sub Test()
    Dim shp As Shape
    Set shp = ActiveSheet.Shapes.AddLabel(1, 100, 20, 60, 150)  ' Add label
    shp.TextFrame.Characters.Text = "Test Python Label"        ' Label text
End Sub
Running this procedure generates the label shown in Figure 5-8.
【Python】 Enter the following in the Python Shell:
>>> shp = sht.api.Shapes.AddLabel(1, 100, 20, 60, 150)               # Add label
>>> shp.TextFrame2.TextRange.Characters.Text = 'Test Python Label'  # Label text
The generated label is shown in Figure 5-8.
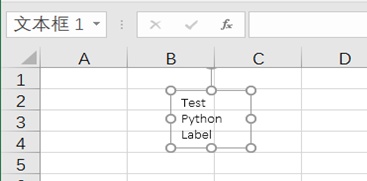
Figure 5-8
Text Boxes
Text boxes can be created using the AddTextbox method of the Shapes object. The calling format and parameter meanings of the AddTextbox method are the same as those of the AddLabel method.
Below is an example of adding a text box containing text to worksheet sht.
【Excel VBA】 The sample file path is: Samples\ch17\Excel VBA\Text Boxes.xlsm.
Sub Test()
    Dim shp As Shape
    Set shp = ActiveSheet.Shapes.AddTextbox(1, 10, 10, 100, 50)
    shp.TextFrame.Characters.Text = "Test Box"
End Sub
Running this procedure generates the text box shown in Figure 5-9.
【Python】 Enter the following in the Python Shell:
>>> shp = sht.api.Shapes.AddTextbox(1, 10, 10, 100, 50)
>>> shp.TextFrame2.TextRange.Characters.Text = 'Test Box'
The generated text box is shown in Figure 5-9.
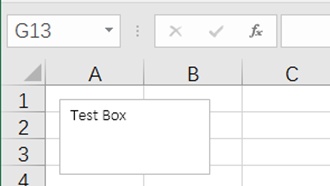
Figure 5-9
Callouts
Callouts can be added using the AddCallout method of the Shapes object. The syntax of the AddCallout method is as follows.
【Excel VBA】
sht.Shapes.AddCallout(Type, Left, Top, Width, Height)
【Python】
sht.api.Shapes.AddCallout(Type, Left, Top, Width, Height)
Here, sht represents a worksheet object. The parameters of the AddCallout method are listed in Table 5-6. The AddCallout method returns a Shape object representing the callout.
Table 5-6 Parameters of the AddCallout Method
| Name | Required/Optional | Data Type | Description |
|---|---|---|---|
| Type | Required | msoCalloutType | Type of the callout line |
| Left | Required | Single | Position of the top-left corner of the callout bounding box relative to the top-left corner of the document (in points) |
| Top | Required | Single | Position of the top-left corner of the callout bounding box relative to the top of the document (in points) |
| Width | Required | Single | Width of the callout border (in points) |
| Height | Required | Single | Height of the callout border (in points) |
The Type parameter takes values from the msoCalloutType enumeration, which specifies the type of the callout line, as listed in Table 5-7.
Table 5-7 Values of the Type Parameter of AddCallout
| Name | Value | Description |
|---|---|---|
| msoCalloutFour | 4 | Two-segment callout line attached to the right side of the text bounding box |
| msoCalloutMixed | -2 | Return value only, indicating a combination of other states |
| msoCalloutOne | 1 | Single-segment horizontal callout line |
| msoCalloutThree | 3 | Two-segment callout line connected to the left side of the text bounding box |
| msoCalloutTwo | 2 | Single-segment slanted callout line |
Below is an example of adding a callout containing text to worksheet sht.
【Excel VBA】 The sample file path is: Samples\ch17\Excel VBA\Callouts.xlsm.
Sub Test()
    Dim shp As Shape
    Set shp = ActiveSheet.Shapes.AddCallout(2, 10, 10, 100, 50)
    shp.TextFrame.Characters.Text = "Test Box"
End Sub
The generated callout is shown in Figure 5-10.
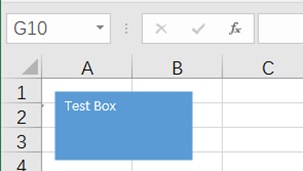
Figure 5-10
【Python】 Enter the following in the Python Shell:
>>> shp = sht.api.Shapes.AddCallout(2, 10, 10, 100, 50)
>>> shp.TextFrame2.TextRange.Characters.Text = 'Test Box'
The generated callout is shown in Figure 5-10.
Next, set the Callout properties of the shp object.
【Excel VBA】 The sample file path is: Samples\ch17\Excel VBA\Callouts.xlsm.
Sub Test2()
    Dim shp As Shape
    Set shp = ActiveSheet.Shapes.AddCallout(2, 110, 40, 200, 60)
    shp.TextFrame.Characters.Text = "Test Box"
    shp.Callout.Accent = True
    shp.Callout.Border = True
    shp.Callout.Angle = 2
End Sub
The generated callout is shown in Figure 5-11.
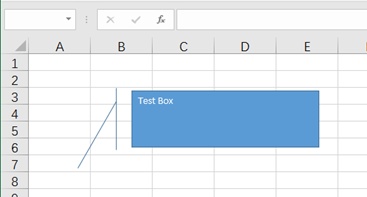
Figure 5-11
【Python】 Enter the following in the Python Shell:
>>> shp = sht.api.Shapes.AddCallout(2, 110, 40, 200, 60)
>>> shp.TextFrame2.TextRange.Characters.Text = 'Test Box'
>>> shp.Callout.Accent = True
>>> shp.Callout.Border = True
>>> shp.Callout.Angle = 2
Here, the Accent property sets the vertical line on the right side of the leader line; the Border property sets the outer frame of the callout area; the Angle property sets the angle of the leader line (here set to 30°). The generated callout is shown in Figure 5-11.
AutoShapes
AutoShapes refer to many predefined graphical objects in Excel. AutoShapes can be created using the AddShape method of the Shapes object. Previously, the AddShape method was used to create points, rectangles, ellipses, etc. In fact, there are many other shape types; Table 5-8 lists some examples.
Table 5-8 Some AutoShapes
| Name | Value | Description |
|---|---|---|
| msoShapeOval | 9 | Oval |
| msoShapeOvalCallout | 107 | Oval callout |
| msoShapeParallelogram | 12 | Slanted parallelogram |
| msoShapePie | 142 | Circle ("pie chart") with a missing segment |
| msoShapeQuadArrow | 39 | Arrow pointing up, down, left, and right |
| msoShapeQuadArrowCallout | 59 | Callout with arrows pointing up, down, left, and right |
| msoShapeRectangle | 1 | Rectangle |
| msoShapeRectangularCallout | 105 | Rectangular callout |
| msoShapeRightArrow | 33 | Right arrow |
| msoShapeRightArrowCallout | 53 | Callout with right arrow |
| msoShapeRightBrace | 32 | Right brace |
| msoShapeRightBracket | 30 | Right bracket |
| msoShapeRightTriangle | utf-8 | Right-angled triangle |
Continued Table
| Name | Value | Description |
|---|---|---|
| msoShapeRound1Rectangle | 151 | Rectangle with one rounded corner |
| msoShapeRound2DiagRectangle | 157 | Rectangle with two diagonally opposite rounded corners |
| msoShapeRound2SameRectangle | 152 | Rectangle with two rounded corners on the same side |
| msoShapeRoundedRectangle | 5 | Rounded rectangle |
| msoShapeRoundedRectangularCallout | 106 | Rounded rectangular callout |
Below is an example of adding a rectangle, a parallelogram, and a smiley face shape to worksheet sht.
【Excel VBA】 The sample file path is: Samples\ch17\Excel VBA\AutoShapes.xlsm.
Sub Test()
    ActiveSheet.Shapes.AddShape 1, 50, 50, 100, 200
    ActiveSheet.Shapes.AddShape 12, 250, 50, 100, 100
    ActiveSheet.Shapes.AddShape 17, 450, 50, 100, 100
End Sub
Running this procedure generates the AutoShapes shown in Figure 5-12.
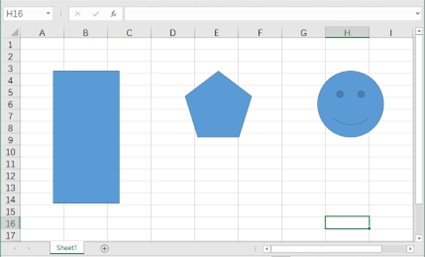
Figure 5-12
【Python】 Enter the following in the Python Shell:
>>> sht.api.Shapes.AddShape(1, 50, 50, 100, 200)
>>> sht.api.Shapes.AddShape(12, 250, 50, 100, 100)
>>> sht.api.Shapes.AddShape(17, 450, 50, 100, 100)
The generated AutoShapes are shown in Figure 5-12.
WordArt
WordArt can be created using the AddTextEffect method of the Shapes object. The syntax of the AddTextEffect method is as follows.
【Excel VBA】
sht.Shapes.AddTextEffect(PresetTextEffect, Text, FontName, FontSize, FontBold, FontItalic, Left, Top)
【Python】
sht.api.Shapes.AddTextEffect(PresetTextEffect, Text, FontName, FontSize, FontBold, FontItalic, Left, Top)
Here, sht is the current worksheet. The parameters of the AddTextEffect method are listed in Table 5-9.
Table 5-9 Parameters of the AddTextEffect Method
| Name | Required/Optional | Data Type | Description |
|---|---|---|---|
| PresetTextEffect | Required | msoPresetTextEffect | Preset effect of the WordArt |
| Text | Required | String | Text in the WordArt |
| FontName | Required | String | Name of the font used in the WordArt |
| FontSize | Required | Single | Font size used in the WordArt (in points) |
| FontBold | Required | msoTriState | Whether the font in the WordArt is bold |
| FontItalic | Required | msoTriState | Whether the font in the WordArt is italic |
| Left | Required | Single | X-coordinate of the top-left corner |
| Top | Required | Single | Y-coordinate of the top-left corner |
The PresetTextEffect parameter represents the effect of the WordArt. Excel provides approximately 50 preset WordArt effects; Table 5-10 lists a few examples. When creating WordArt, assign the corresponding value to the PresetTextEffect parameter.
Table 5-10 Values of the PresetTextEffect Parameter
| Name | Value | Description |
|---|---|---|
| msoTextEffect1 | 0 | First text effect |
| msoTextEffect2 | 1 | Second text effect |
| msoTextEffect3 | 2 | Third text effect |
Below is an example of creating WordArt with two different effects.
【Excel VBA】 The sample file path is: Samples\ch17\Excel VBA\WordArt.xlsm.
Sub Test()
    ActiveSheet.Shapes.AddTextEffect 19, _
        "Learning PYTHON", "Arial Black", 36, _
        False, False, 10, 10
    ActiveSheet.Shapes.AddTextEffect 25, _
        "Spring Sleep Unaware of Dawn", "SimHei", 40, _
        False, False, 30, 50
End Sub
Running this procedure generates the WordArt shown in Figure 5-13.
【Python】 Enter the following code in the Python Shell:
>>> sht.api.Shapes.AddTextEffect(9, 'Learning PYTHON', 'Arial Black', 36, False, False, 10, 10)
>>> sht.api.Shapes.AddTextEffect(29, 'Spring Sleep Unaware of Dawn', 'SimHei', 40, False, False, 30, 50)
The generated WordArt is shown in Figure 5-13.